 Big Data
 Artificial Intelligence
 Search
 Web
Web Data analytics
 Enterprise IT Consulting
 Cloud application developement
 Cloud - Devops development
 Natural language processing
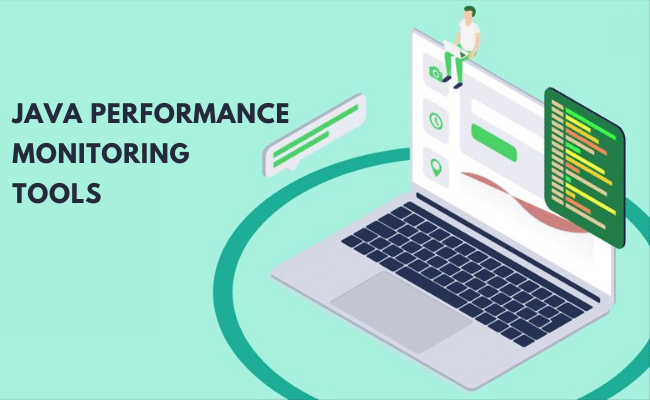
 Java Software Development
 Application modernization
 Application Maintenance & Support
 Hire Java Developer
 Hire SpringBoot Developer
 Hire Solr Developer
 Hire ElasticSearch Developer
 Hire Hadoop Developer
 Hire Spark Developer
 Hire NLP developer
 About Us
 Careers
In current age of information technology, Application Performance Management (APM) monitors how effectively software applications perform.
By monitoring application performance, APM makes sure that services are delivered to customers at the required level and pinpoints any issues.
To track or keep an eye on the performance of an application, many metrics can be employed, such as the program’s reaction time and load time.
Nowadays, as more technology is used, applications are getting more dispersed and complicated. It is crucial to keep track of an application’s performance in order to improve the end-user experience.
Table of Contents
Best APM Tools to Look For
Individual web requests, transactions, CPU and memory utilization, application errors, etc. are all part of application performance monitoring.
The most common Website and Application Performance Monitoring APM Tools are described in detail below.
Traceview
Before being acquired by AppNeta and joining SolarWinds, it was known as Tracelytics.
Based in Texas, USA, SolarWinds was founded in 1999. Here, more than 150 people are employed, and $429 million in income is generated.
It is a web application performance monitoring tool. It gives users a better end-user experience, significant insight into the program, and a very cost-effective performance monitoring tool.
Dotcom-Monitor
To better understand the actual user experience, you may evaluate the functionality, performance, and accessibility of your most complex web apps with Dotcom-Monitor APM.
To watch everything from front-end apps and web pages to infrastructure and server data, Dotcom-Monitor provides comprehensive end-to-end application performance monitoring solutions.
Check out our Java development consulting services
To enforce service level agreements, discover performance blind spots, and create a world-class digital user experience.
Scalable worldwide observability for your network infrastructure, web services, and applications. From a single dashboard, get a complete insight into your apps, sites, services, and infrastructure.
eG Innovations
Application performance and IT infrastructure monitoring are eG Innovations’ specialties. Since its founding in 2001, eG Innovations has grown its portfolio to include monitoring for more than 180 applications, including Java, .NET, SAP, SharePoint, Office 365, and others.
The industry-leading application performance monitoring tool from eG Innovations, eG Enterprise, is used by hundreds of businesses worldwide to address problems with sluggish applications, downtime, code-level errors, capacity constraints, hardware malfunctions, configuration changes, and other difficulties.
Application managers, Hire java developers, DevOps, and IT Ops staff may fix problems with applications more quickly by identifying their core causes.
Datadog
To optimize your application, you may use Datadog APM to identify and remove dependencies, eliminate bottlenecks, decrease latency, track mistakes, and improve code efficiency.
You can see the overall health of your application across all hosts, containers, proxies, serverless functions, logs, profiles, synthetic tests, process-level data, and infrastructure metrics thanks to distributed traces.
Sematext APM
Sematext APM provides real-time end-to-end visibility into the performance of online applications by monitoring user and business activity to pinpoint the slow and under-performing elements of your program. It improves user experience and speeds up troubleshooting.
ManageEngine Applications Manager
For today’s complex, dynamic environments, ManageEngine Applications Manager was developed as a full-featured application performance monitoring solution.
Both in the data center and the cloud, business-critical apps are provided substantial performance intelligence. It is quick and easy to set up and utilize.
AppDynamics
An American company called AppDynamics, which is situated in San Francisco, was founded in 2008 and specializes in application performance management. With more than 1000 workers, $118 million in sales was generated in 2017. In Forbes’ ranking of the top 100 cloud computing firms, it came in at position 9.
Currently, AppDynamics is a part of Cisco; the purchase was finished in March 2017. End-to-end, real-time performance of distributed, complicated applications is offered by AppDynamics.
Opsview
Software firm Opsview was established in 2005 and has its main office in Reading, England. It maintains offices in the American city of Woburn, Massachusetts.
Opsview Application Monitoring solutions provide an integrated view of the whole infrastructure and the operation of business applications.
The process of gathering performance data and displaying it in a single context is exceedingly difficult in the age of digital technology since several apps are installed at various places.
Opsview, on the other hand, makes using its automated and unified method simpler.
Dynatrace
Dynatrace was established in 2006 and has offices in Massachusetts, USA. Approximately 2000 people work at Dynatrace at the moment. In the 2017 fiscal year, it earned around $354 million.
The Dynatrace Application Monitoring tool tracks and controls the software application’s performance. Additionally, it guarantees that the software program will be available. Dynatrace APM closely examines every individual and commercial transaction down to the code level.
Hire java developers from ProminentPixel | 7+ Years of Experience
It keeps tabs on infrastructure, actual data, application performance, and the cloud environment.
Application Insights
One of the well-known software companies, Microsoft was established in 1975 and has its US headquarters in Washington. A workforce of more than 124,000 people generates $90 billion in sales. By offering “Application Insights,” a tool that would assist enterprises in understanding how their applications are doing, Microsoft forays into the market for application java performance monitoring tools.
Application Insights, which places a greater emphasis on Hire java developers, was created to track application performance, gather data for troubleshooting, and enhance application performance.
Conclusion
Standard Java profilers provide access to heap dumps for in-depth memory analysis as well as insight into all JVM metrics (memory, CPU, threads, and garbage collection).
They keep track of every method call and memory usage, enabling programmers to easily identify the CPU and memory-intensive areas by delving into the call structure.
As they enable you to manually perform GC, common Java profilers help you find memory leaks. The objects that caused the memory failure can then be quickly identified by analyzing memory use.
On the other hand, profilers require a lot of resources for this level of detail, which slows down the program. Not to mention, they require a connection to the JVM being watched.
The numerous java application monitoring tools for application performance monitoring have been covered in this article.
There are still many APM tools and java monitoring tools on the market that may be selected based on the requirements of the project and the performance of the application.
Read More: Top 5 Reasons Why You Should Adopt Java Development for Your Business?


